Comparing measures of similarity between curves
July 2, 2017
Edit: July 15, 2018
I’ve published a paper on this topic aimed at identifying unique material load/unload curves doi:10.1007/s12289-018-1421-8 pdf. Additionally I’ve created a Python library called similaritymeasures which includes the Partial Curve Mapping method, Area between two curves, Discrete Fréchet distance, and Curve Length based similarity measures. These methods are useful for quantifying the differences between 2D curves.
A simple regression problem is set up to compare the effect of minimizing the sum-of-squares, discrete Fréchet distance, dynamic time warping (DTW) distance, and the area between two curves. The sum-of-squares is minimized with a traditional least squares fit. The discrete Fréchet distance is an approximation of the Fréchet distance which measures the similarity between two curves. The Fréchet distance is famously described with the walking dog analogy. For more on the Fréchet distance, check out this wiki. Dynamic time warping (DTW) has been used famously for speech recognition, and essentially calculates a metric of the similarity between two curves. The wiki page on DTW is pretty useful. I’ve create an algorithm to calculate the area between two curves. The area between two curves can be used as another metric of similarity.
With regression, model parameters are determined by minimizing some measure of the similarity between two curves. With the sum-of-squares error metric, parameters are determined with a least-squares fit. A least squares fit is an easy to solve optimization problem. However model parameters can also be determined with a more expensive global optimization method by minimizing any one of the discrete Fréchet distance, DTW, or area metrics.
Methodology
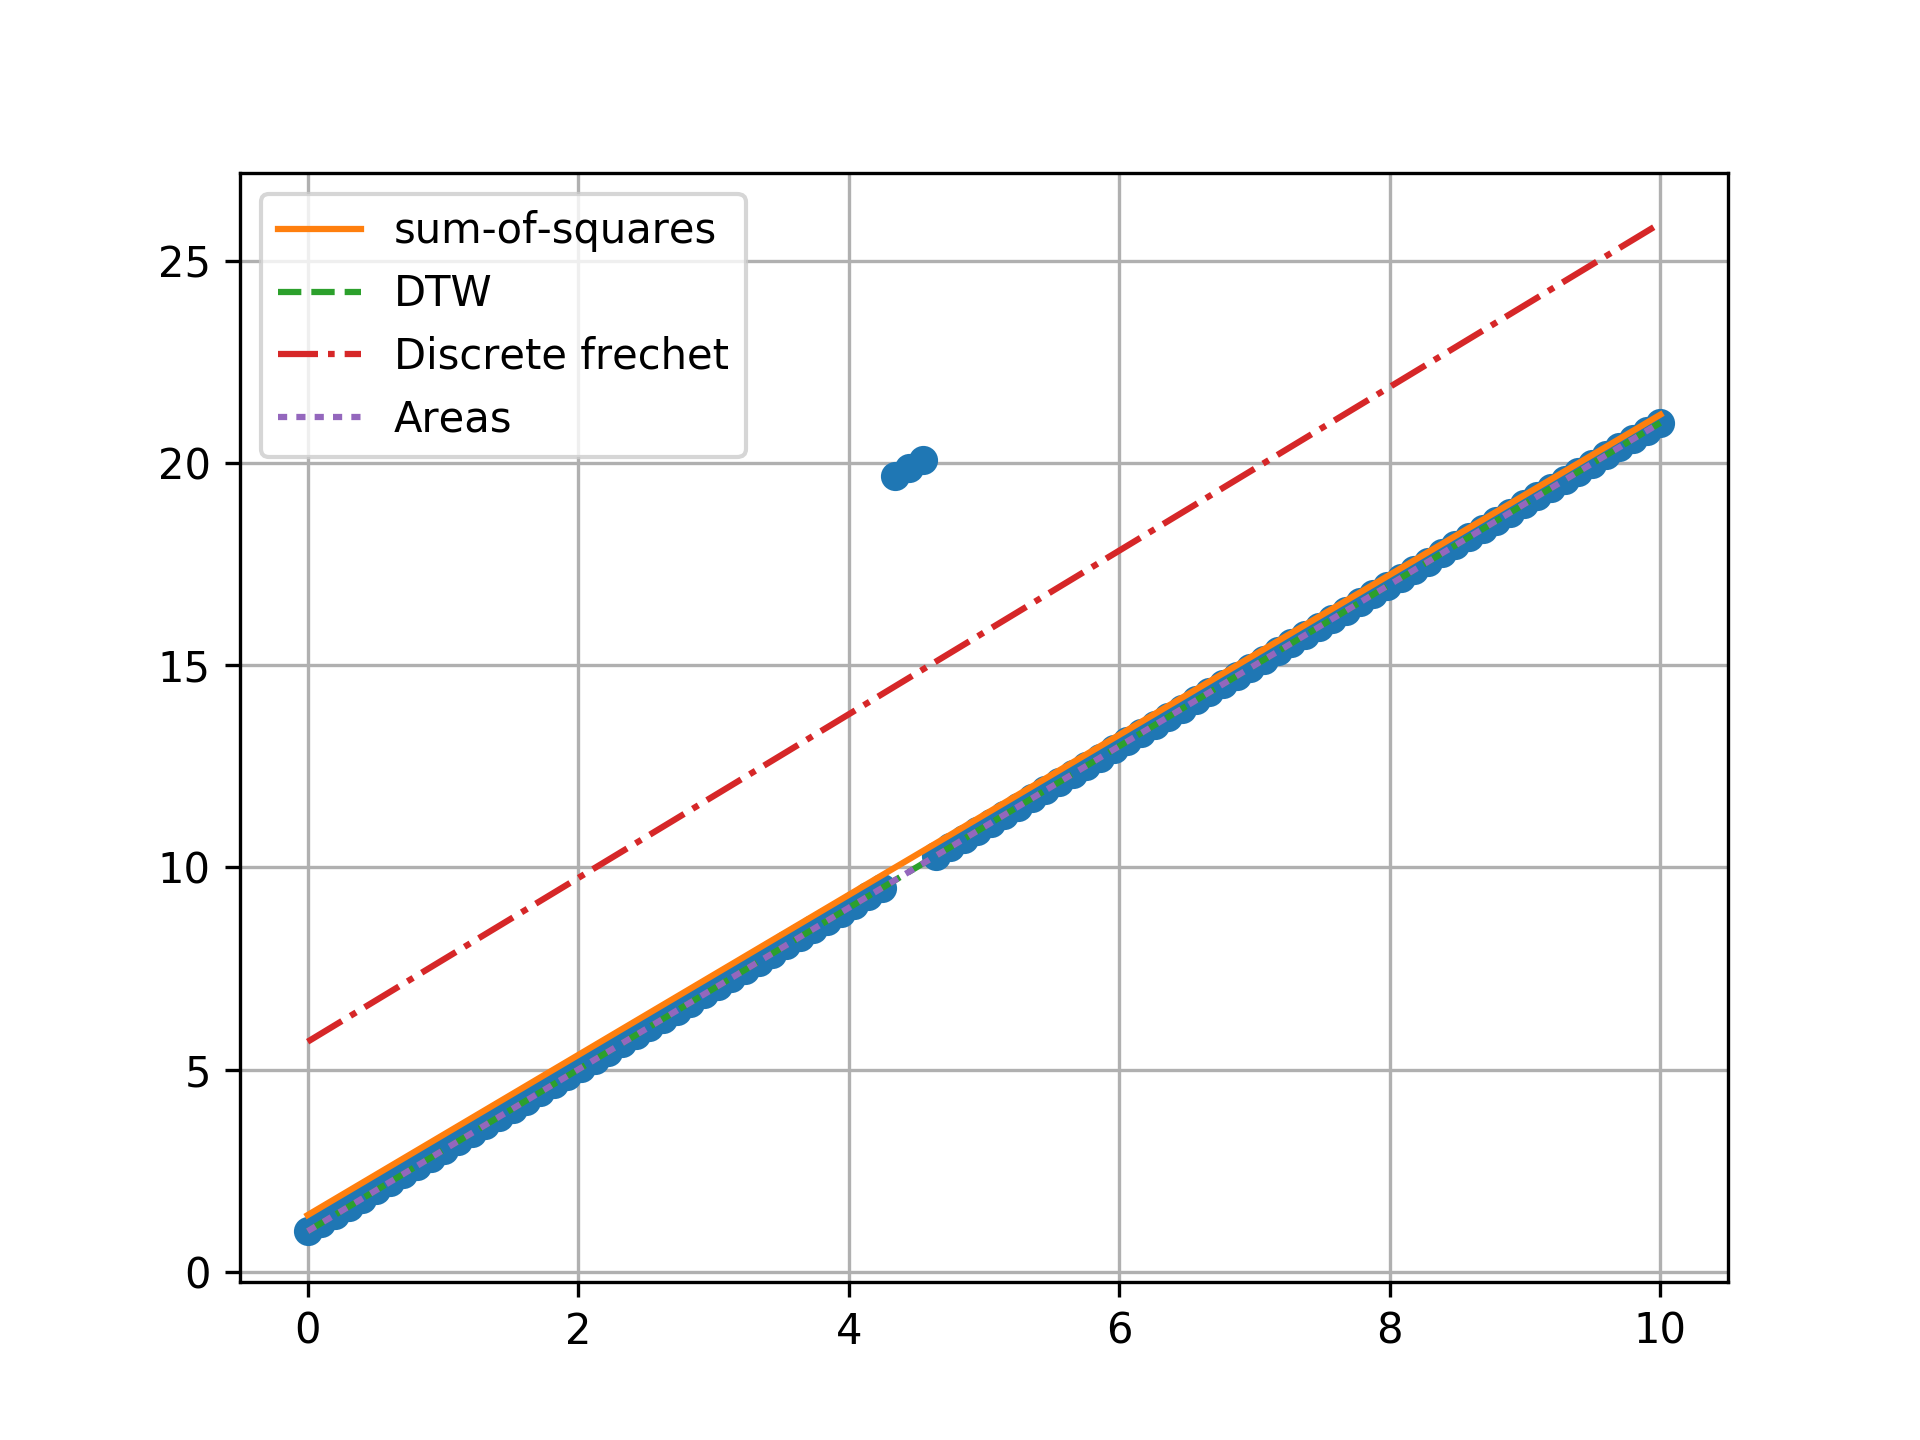
Data is generated from \( y = 2x + 1 \) for \( 0 \leq x \leq 10 \). A line is fit to the data with the \( y = mx + b \) where \( m \) and \( b \) are the two parameters of the line. Various outliers are created by adding or subtracting 10 to the \( y \) value at a particular \( x \) location. Various lines are fit with different outliers to the data. Additionally the number of data points are varied. Lines are fit to the various data sets by minimizing either the sum-of-squares, discrete Fréchet distance, DTW, and area between curves. The intention is to compare the lines from the different metrics of similarity between two curves.
Results
Various fits were attempted by varying the number of data points and outliers. Plots of the fits are shown bellow.
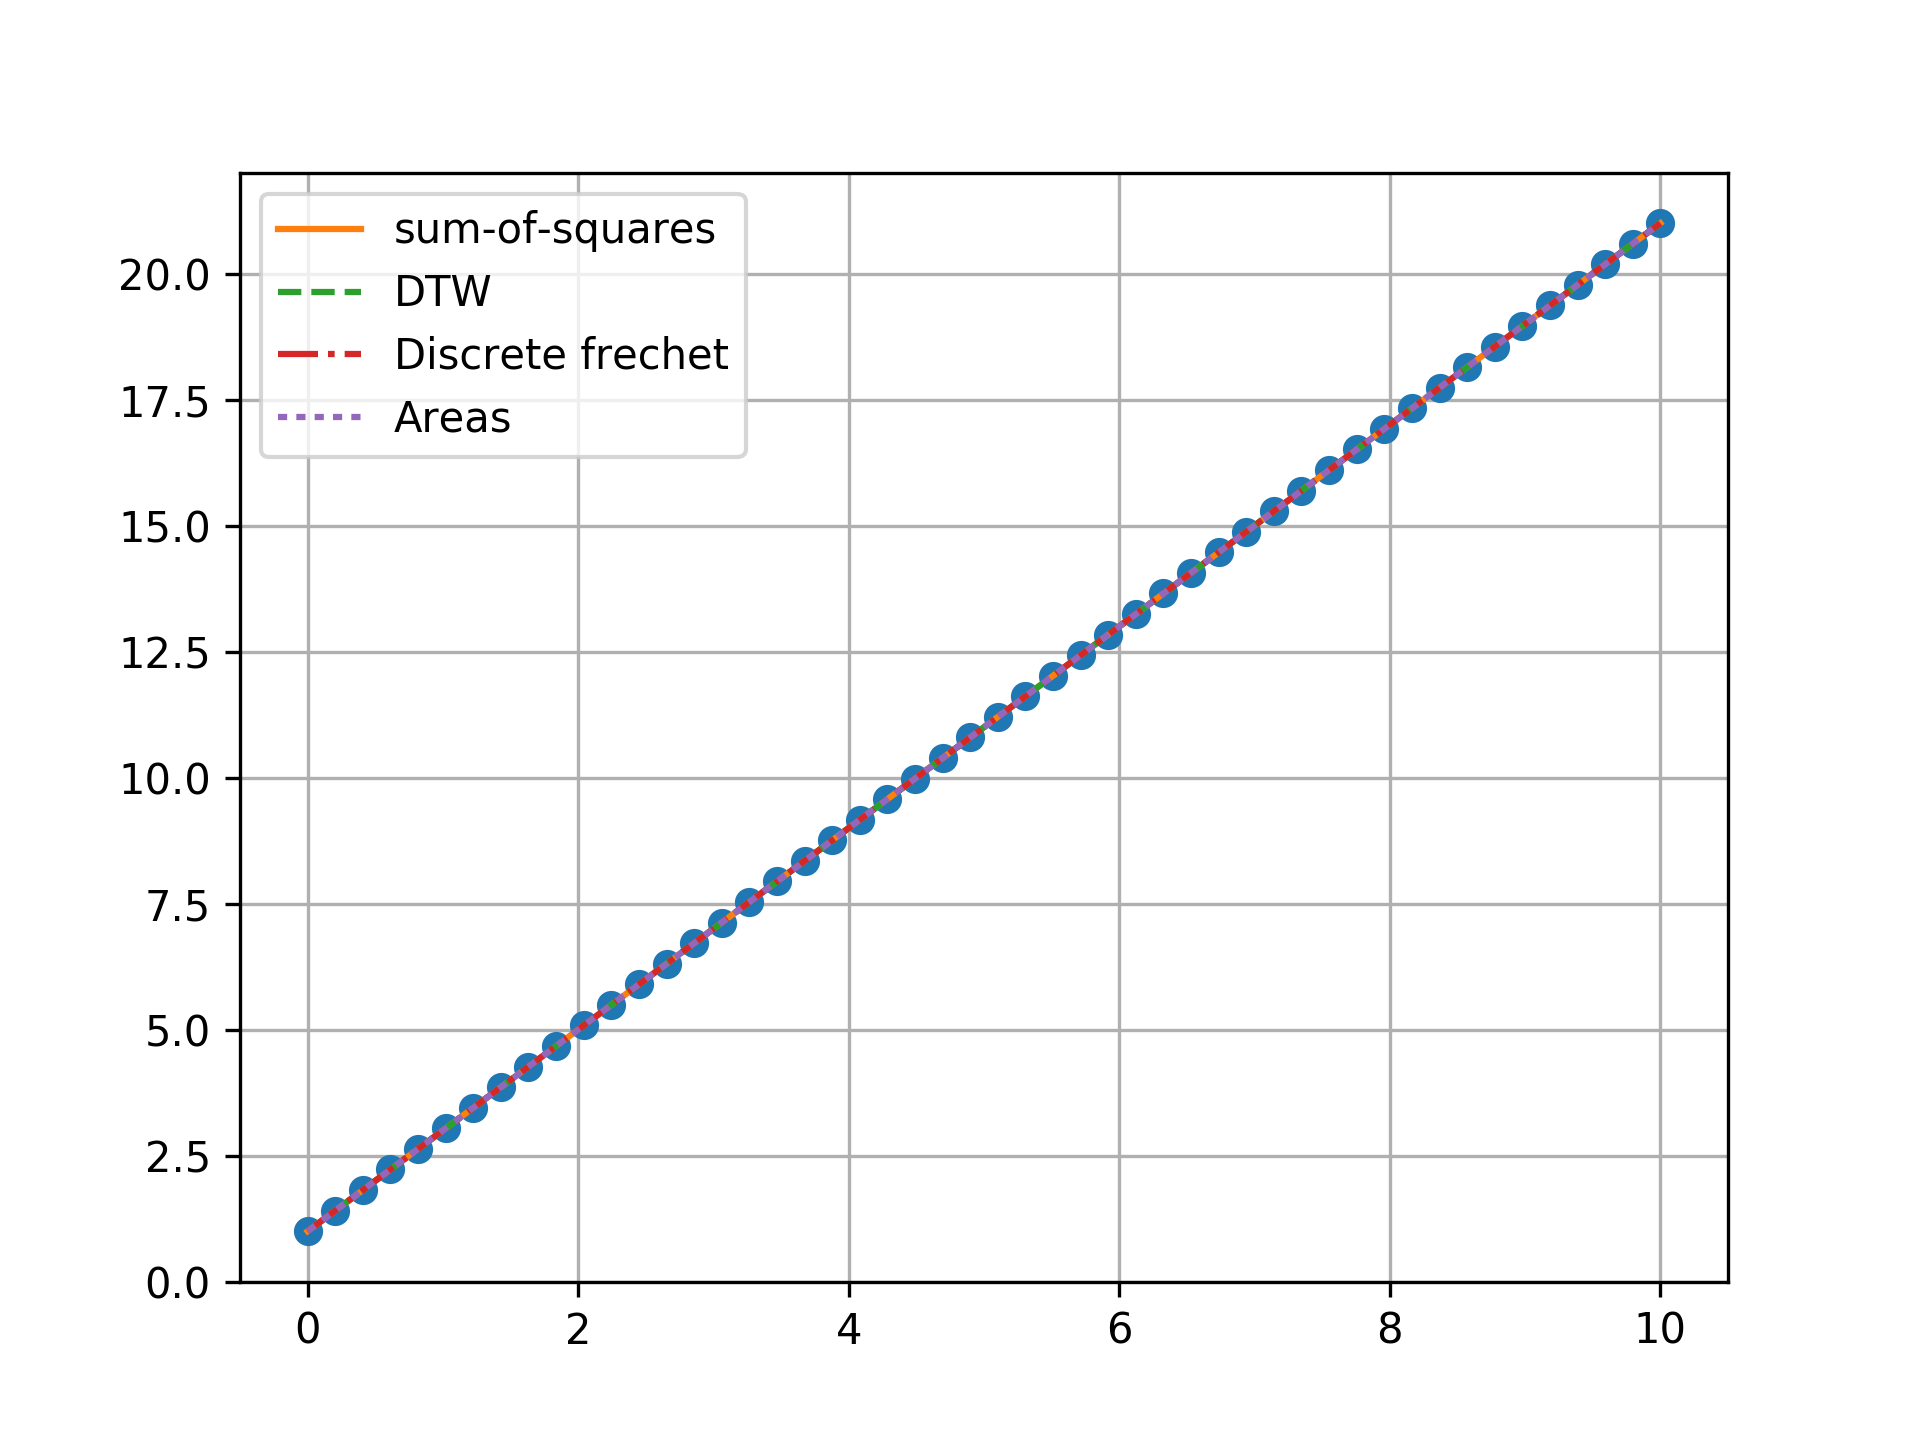
n = 50, no outlier
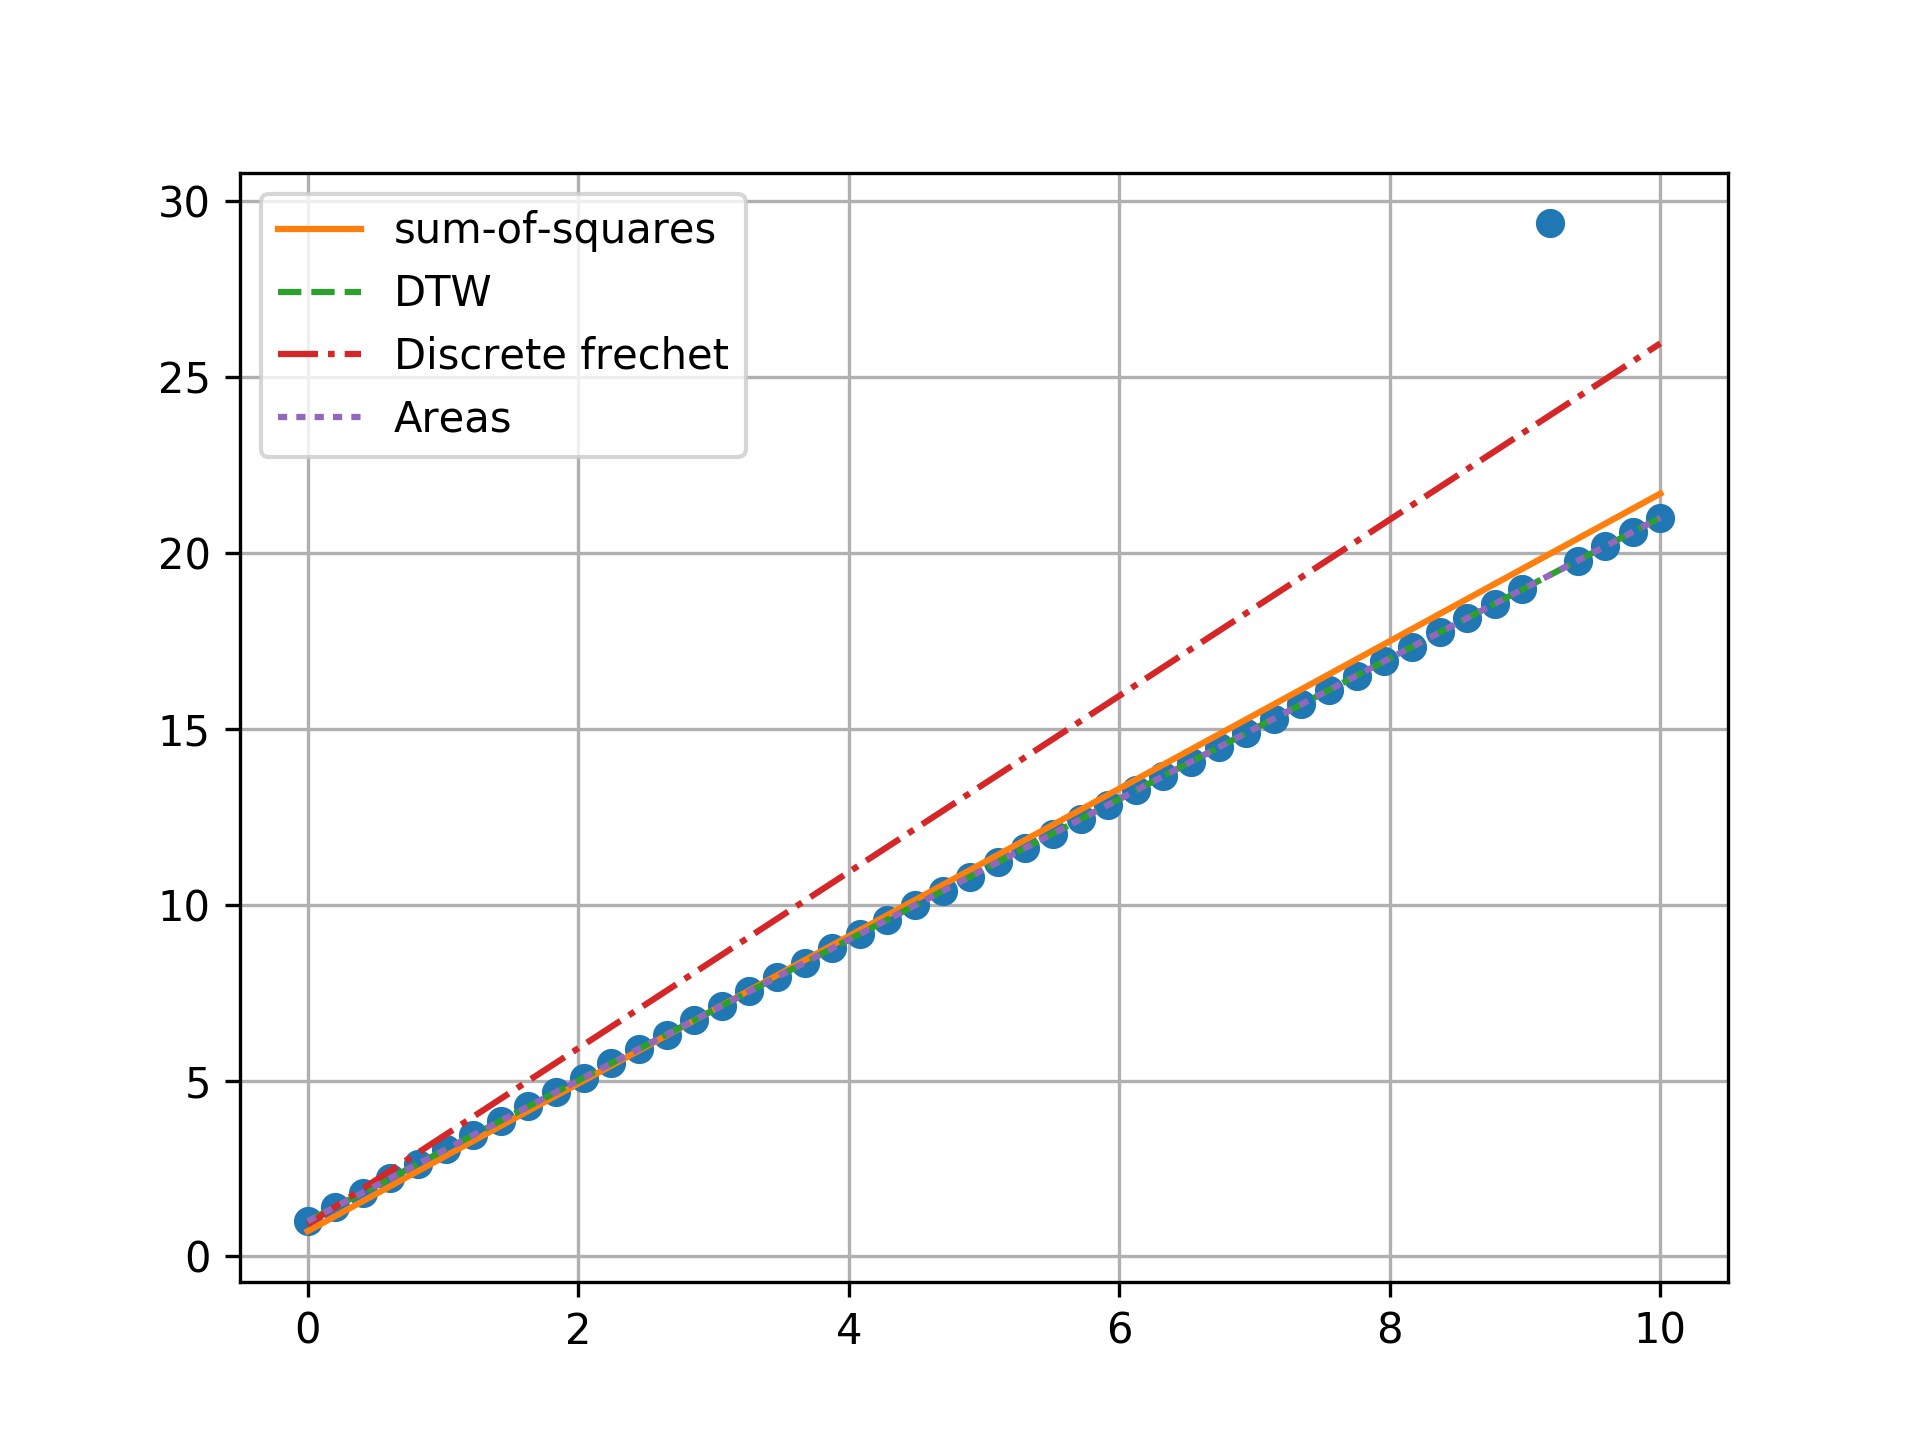
n = 50, one outlier, towards ends
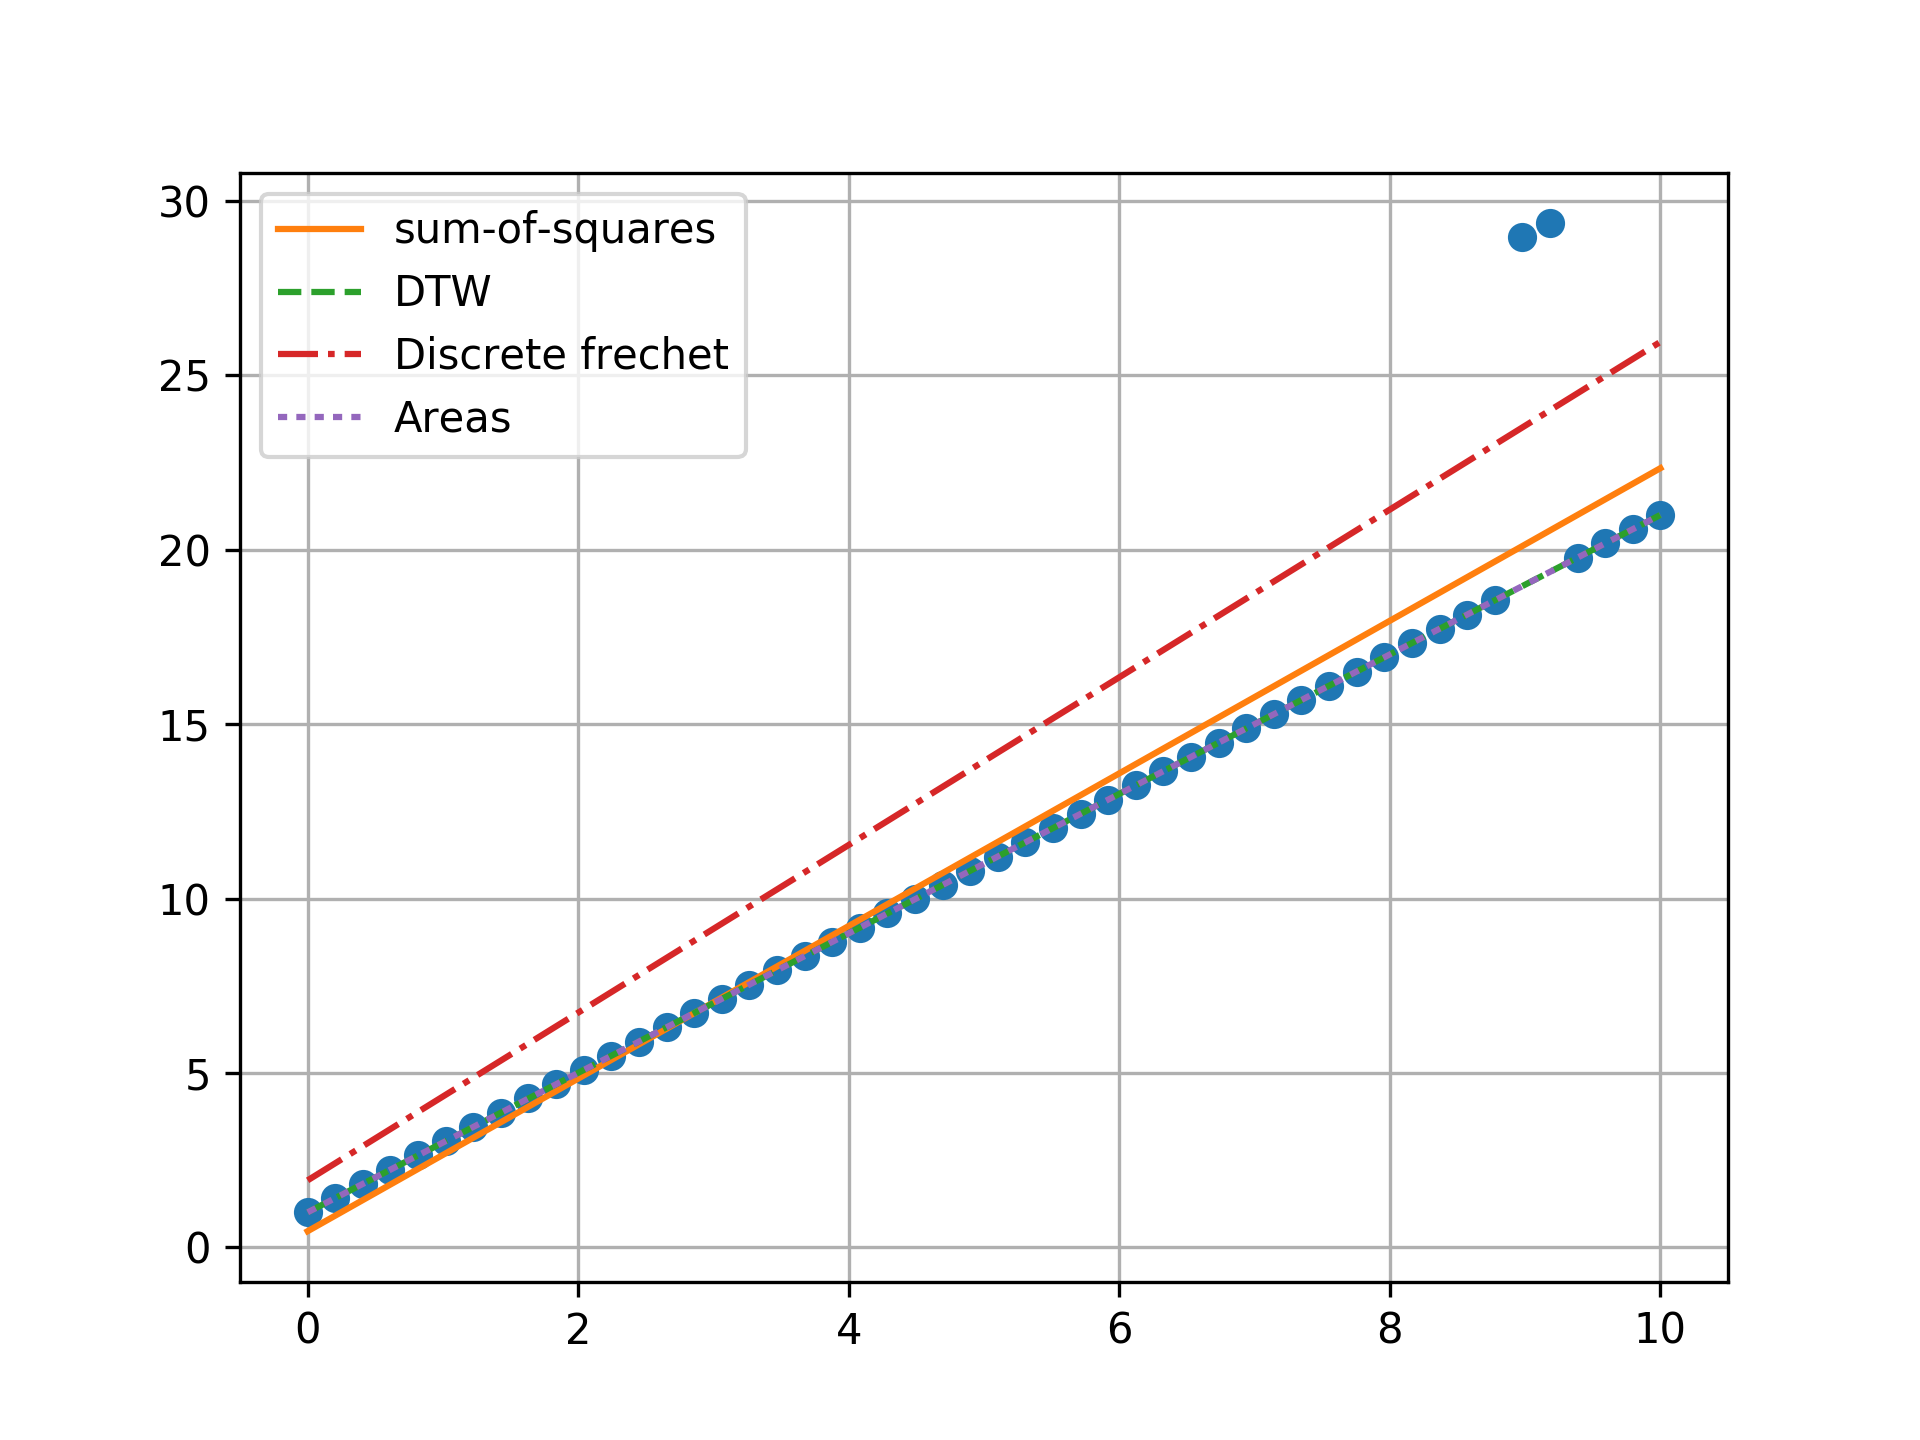
n = 50, two outlier, towards ends
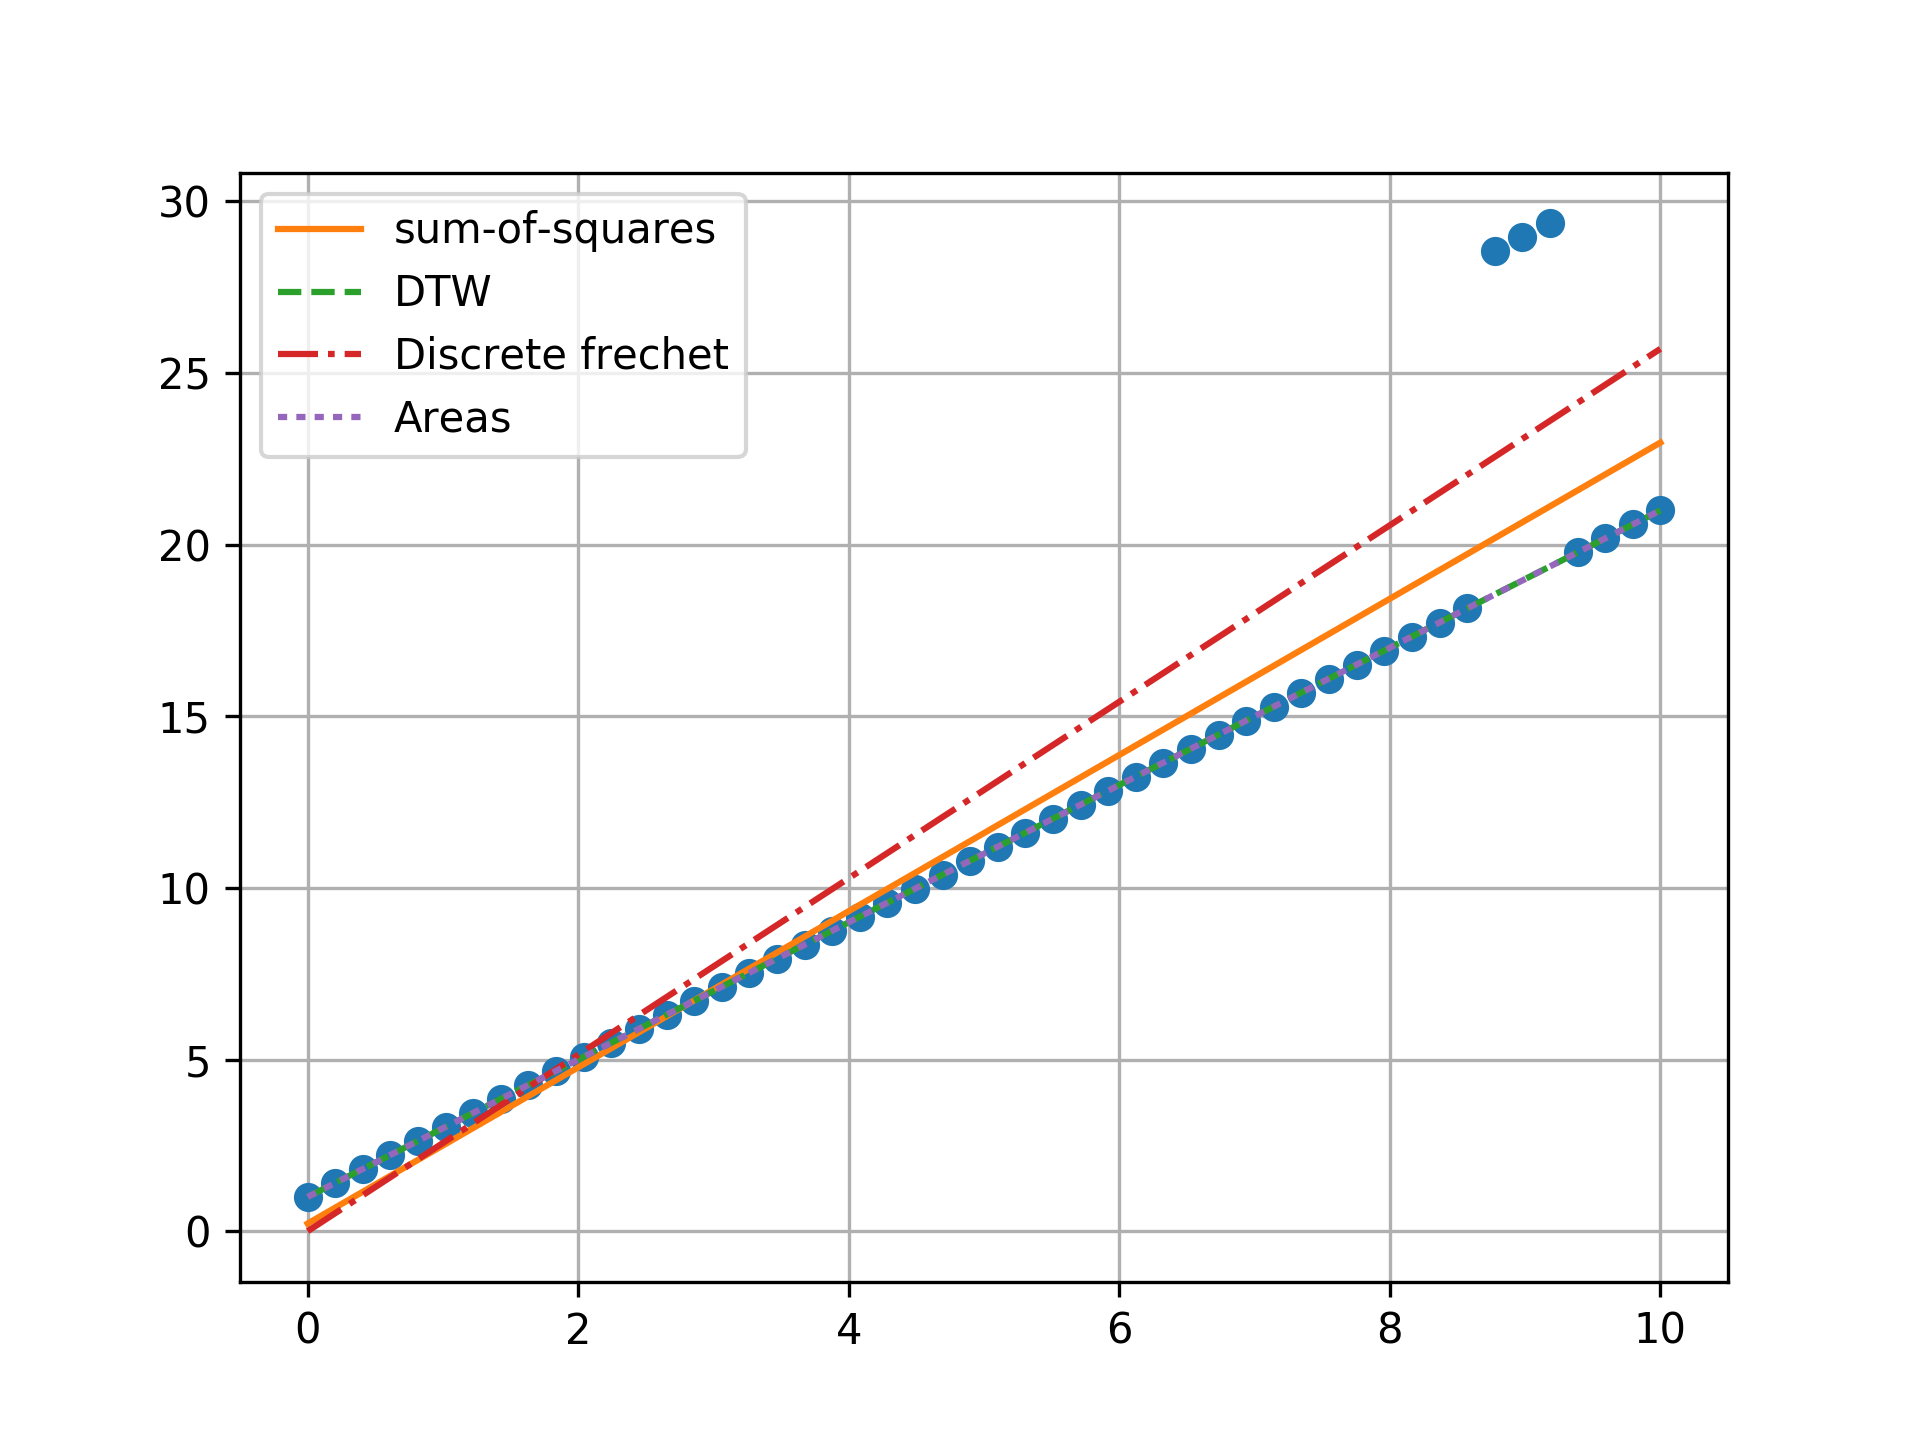
n = 50, three outlier, towards ends
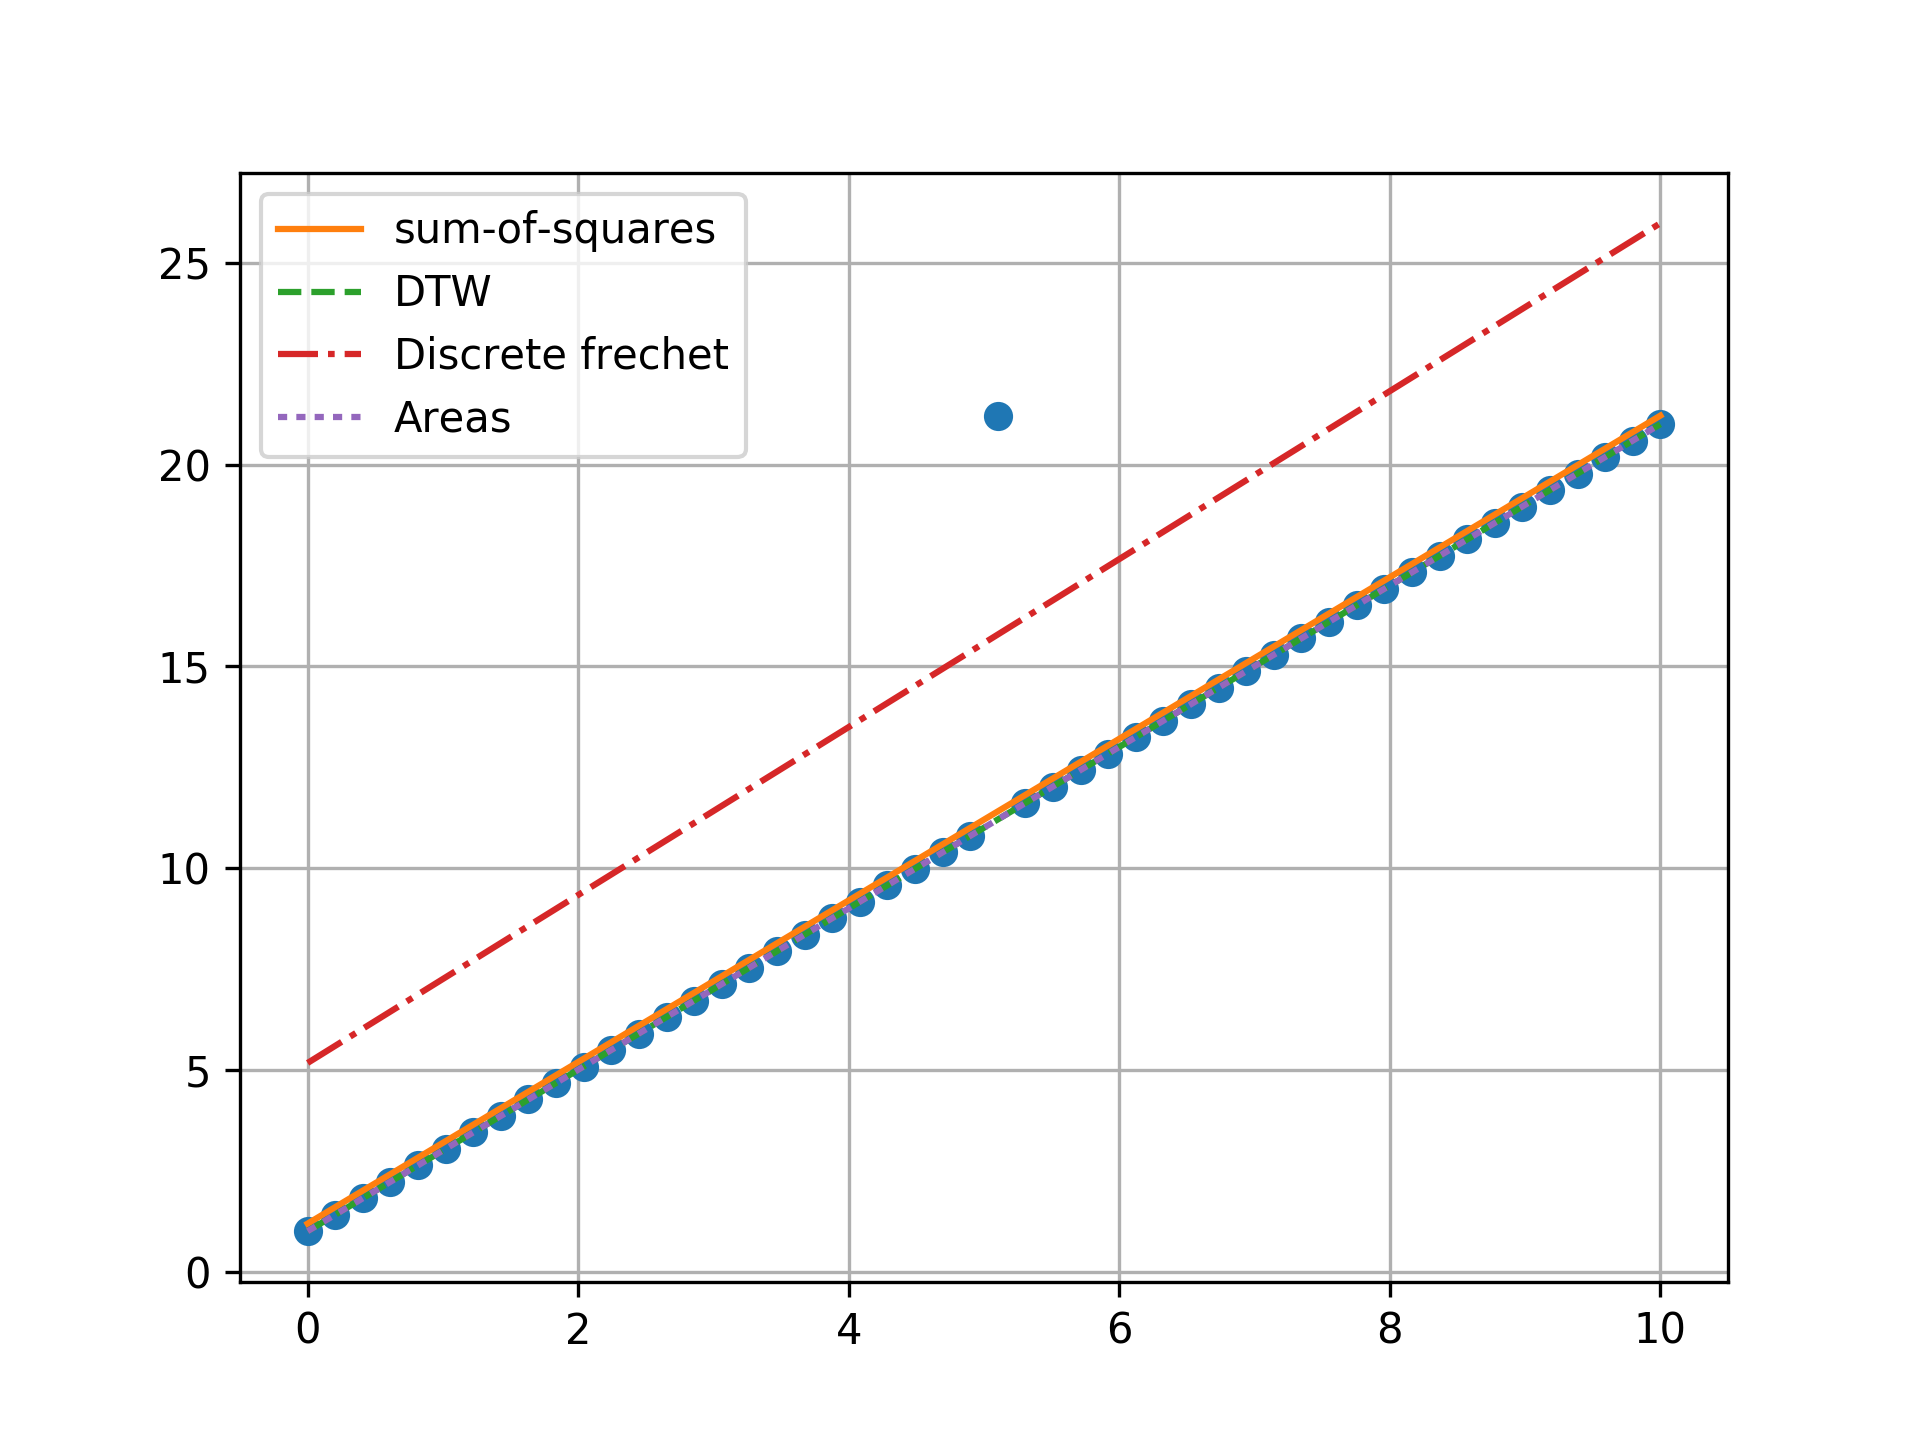
n = 50, one outlier, towards center
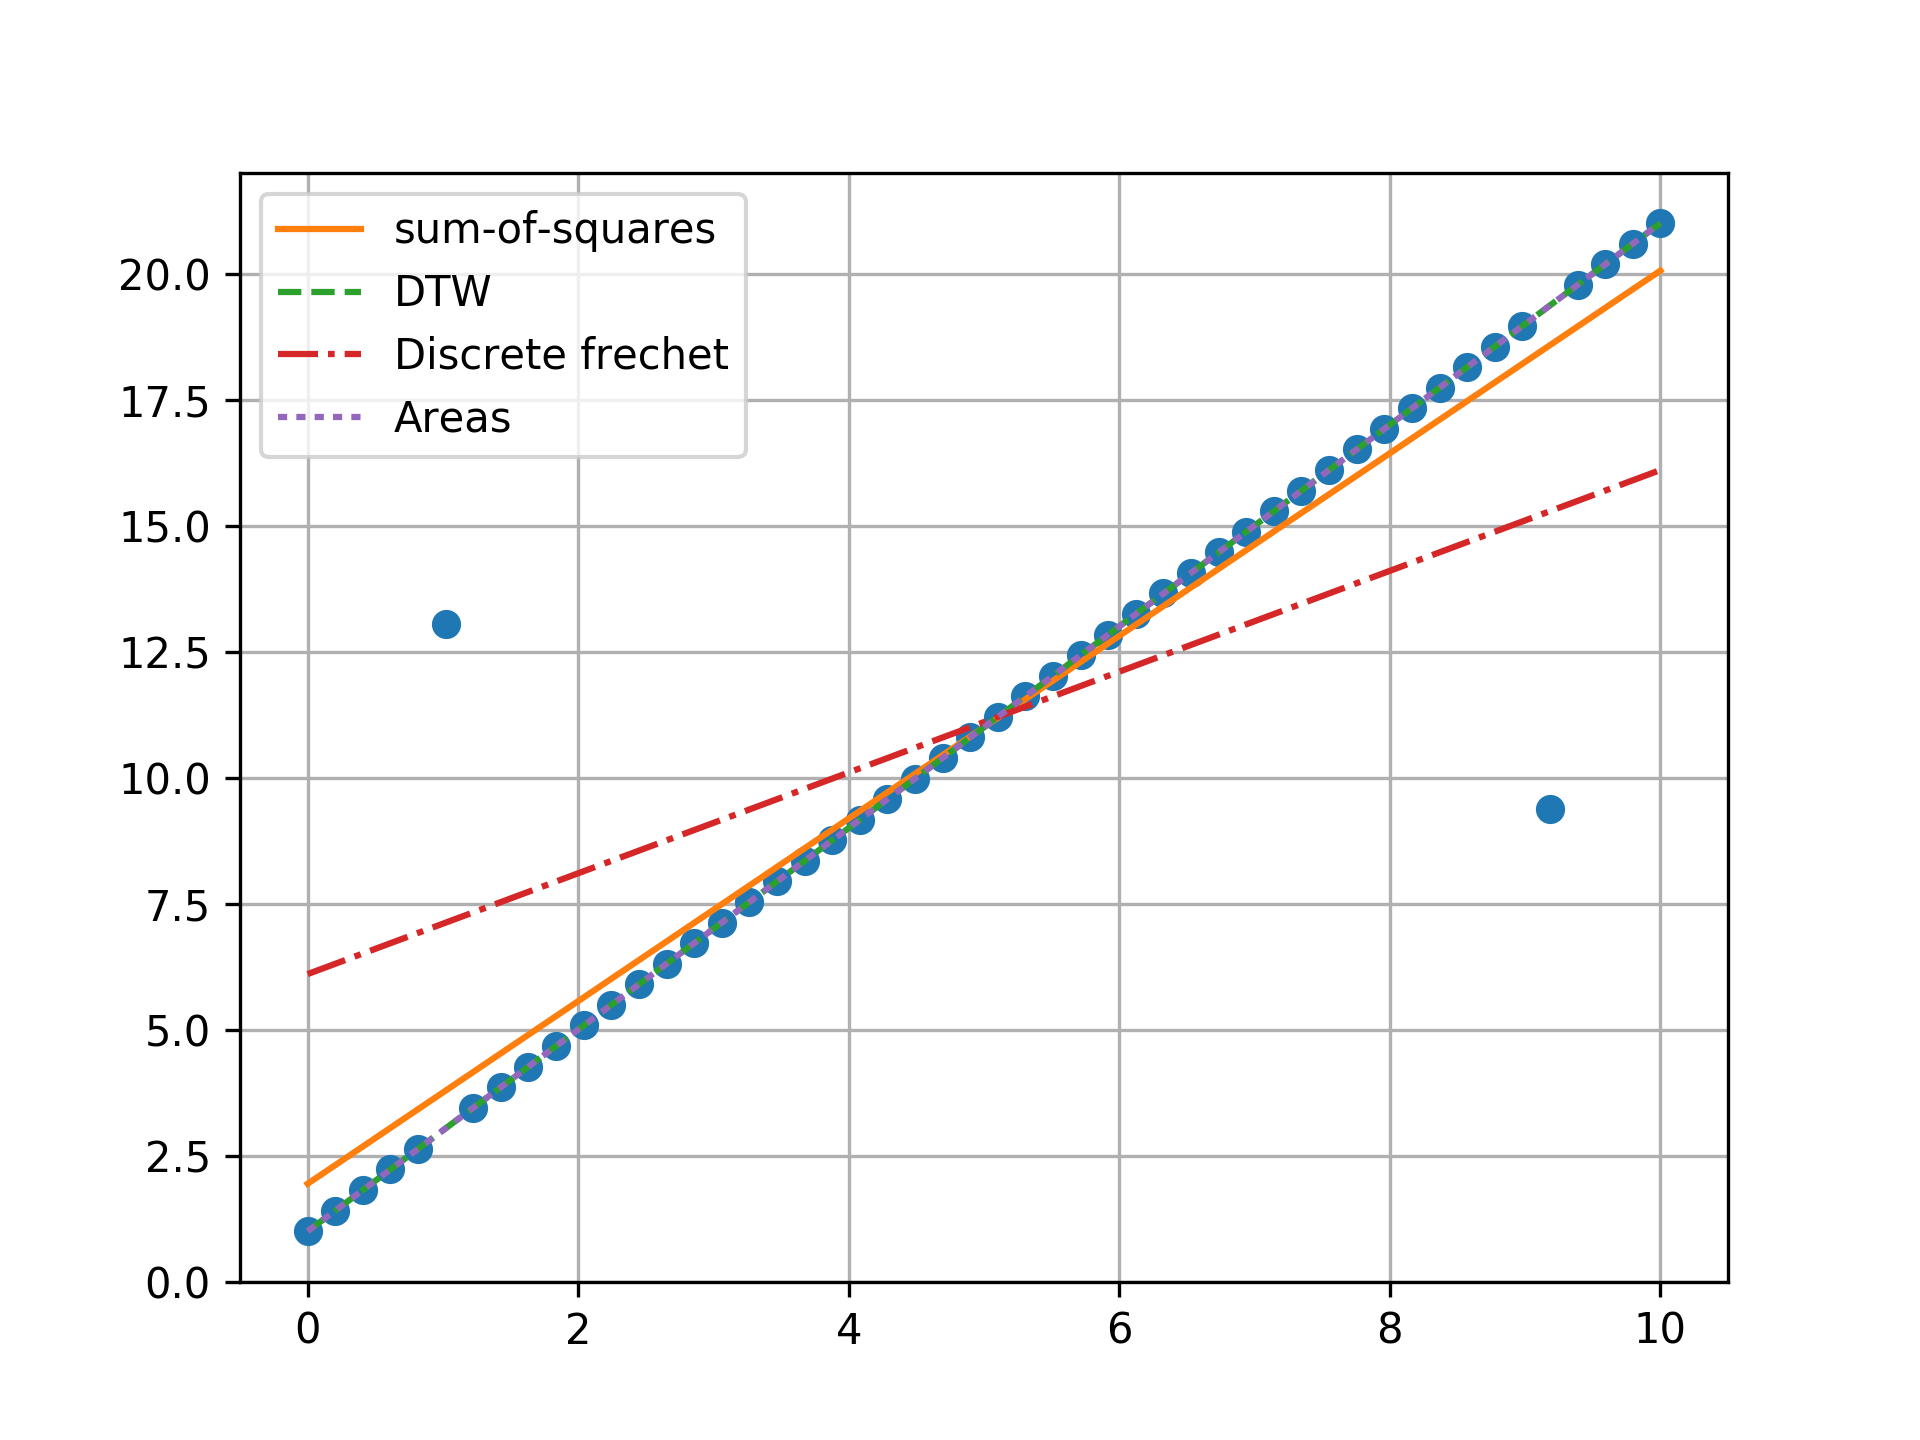
n = 50, two outlier, opposite ends
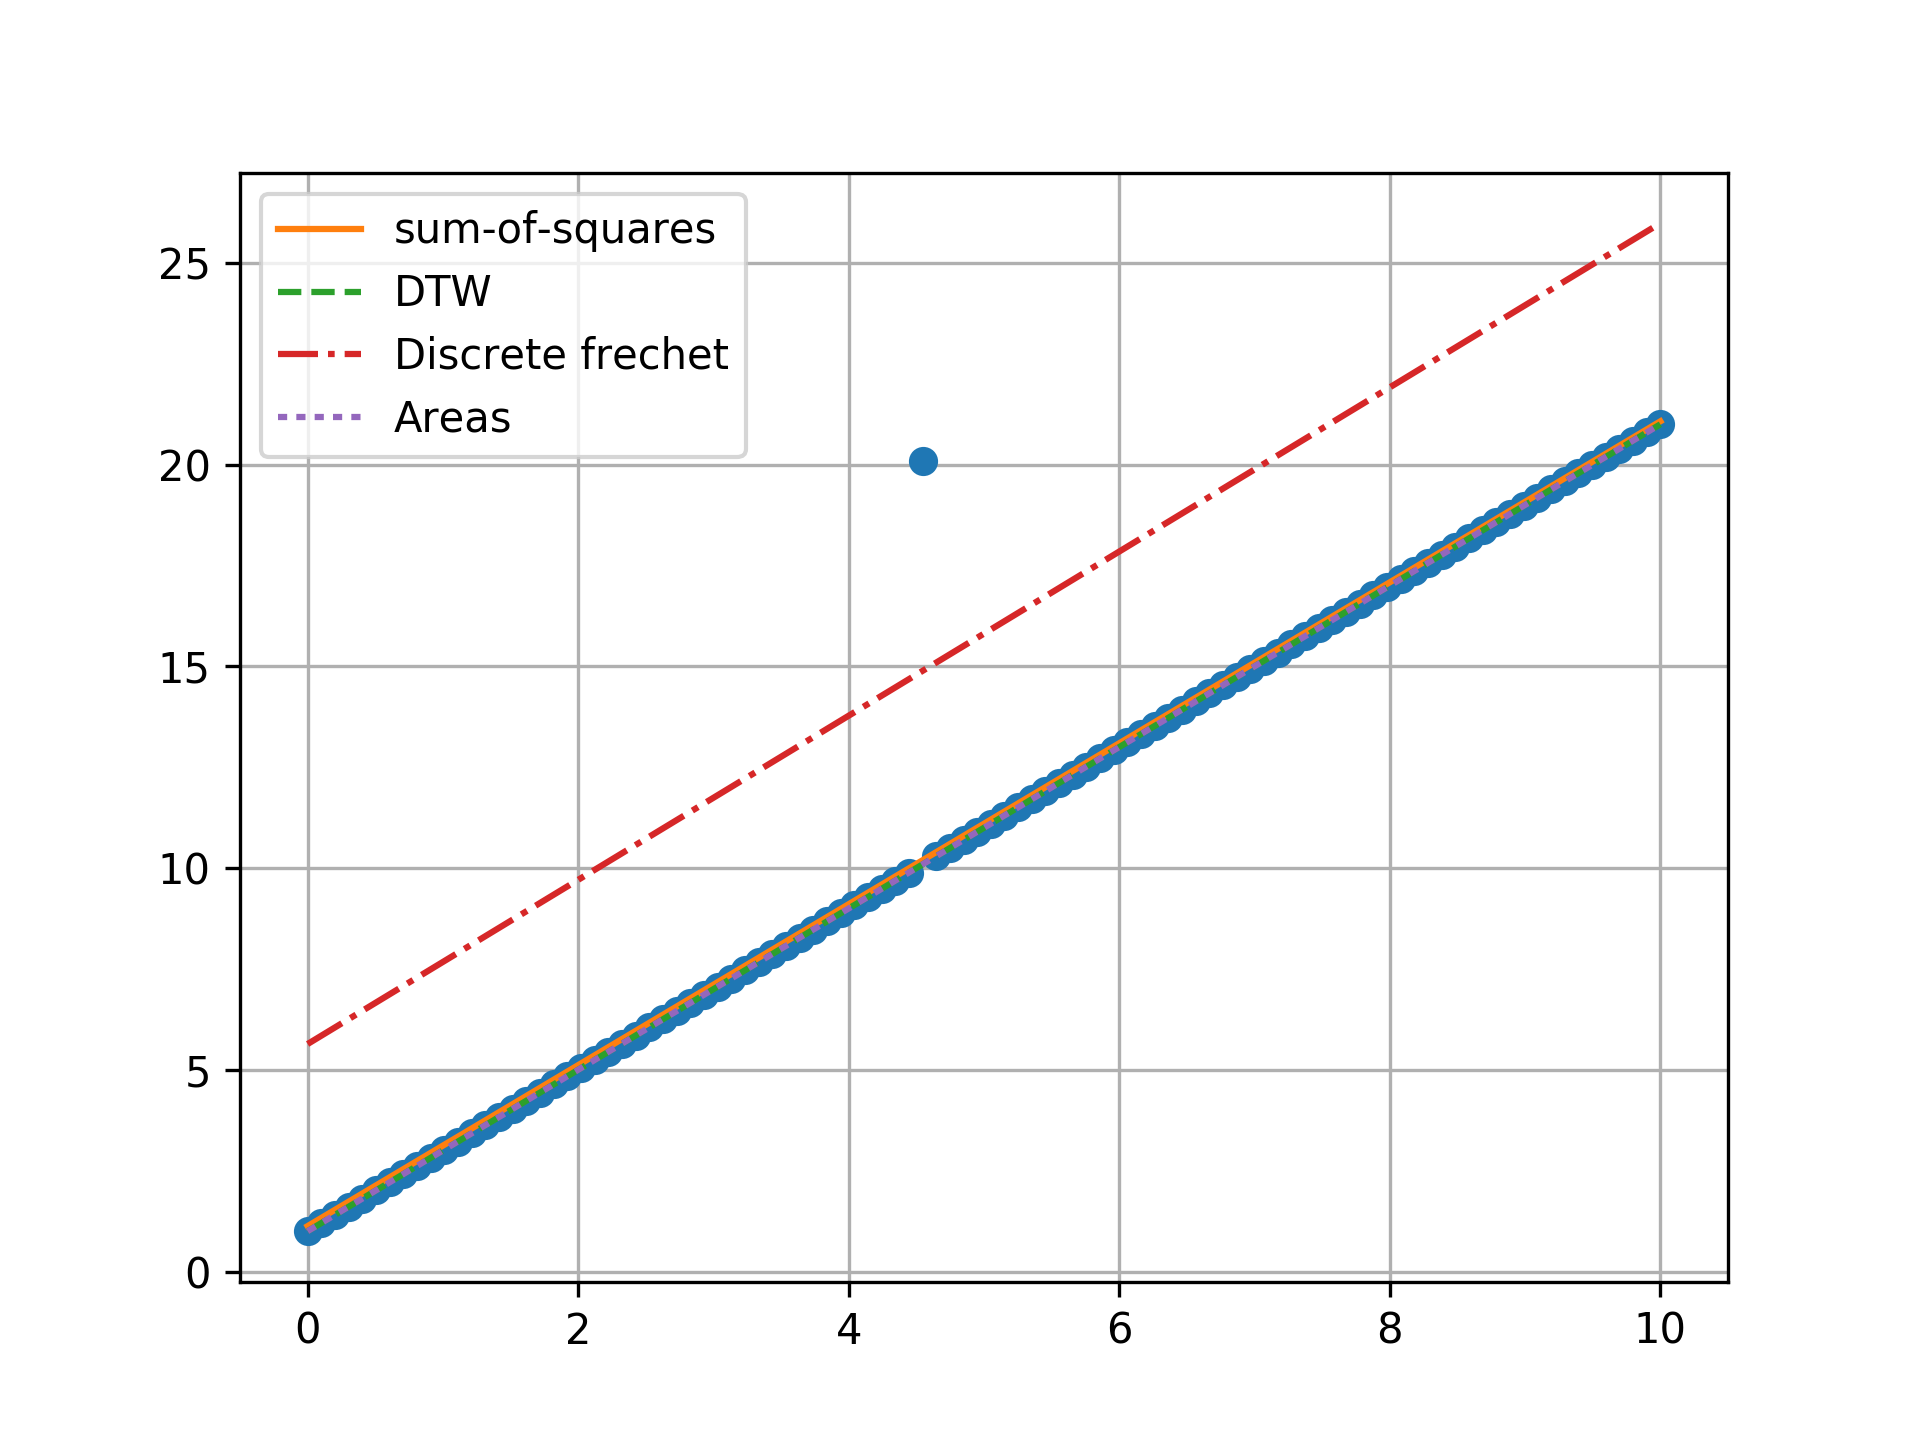
n = 100, one outlier, towards center
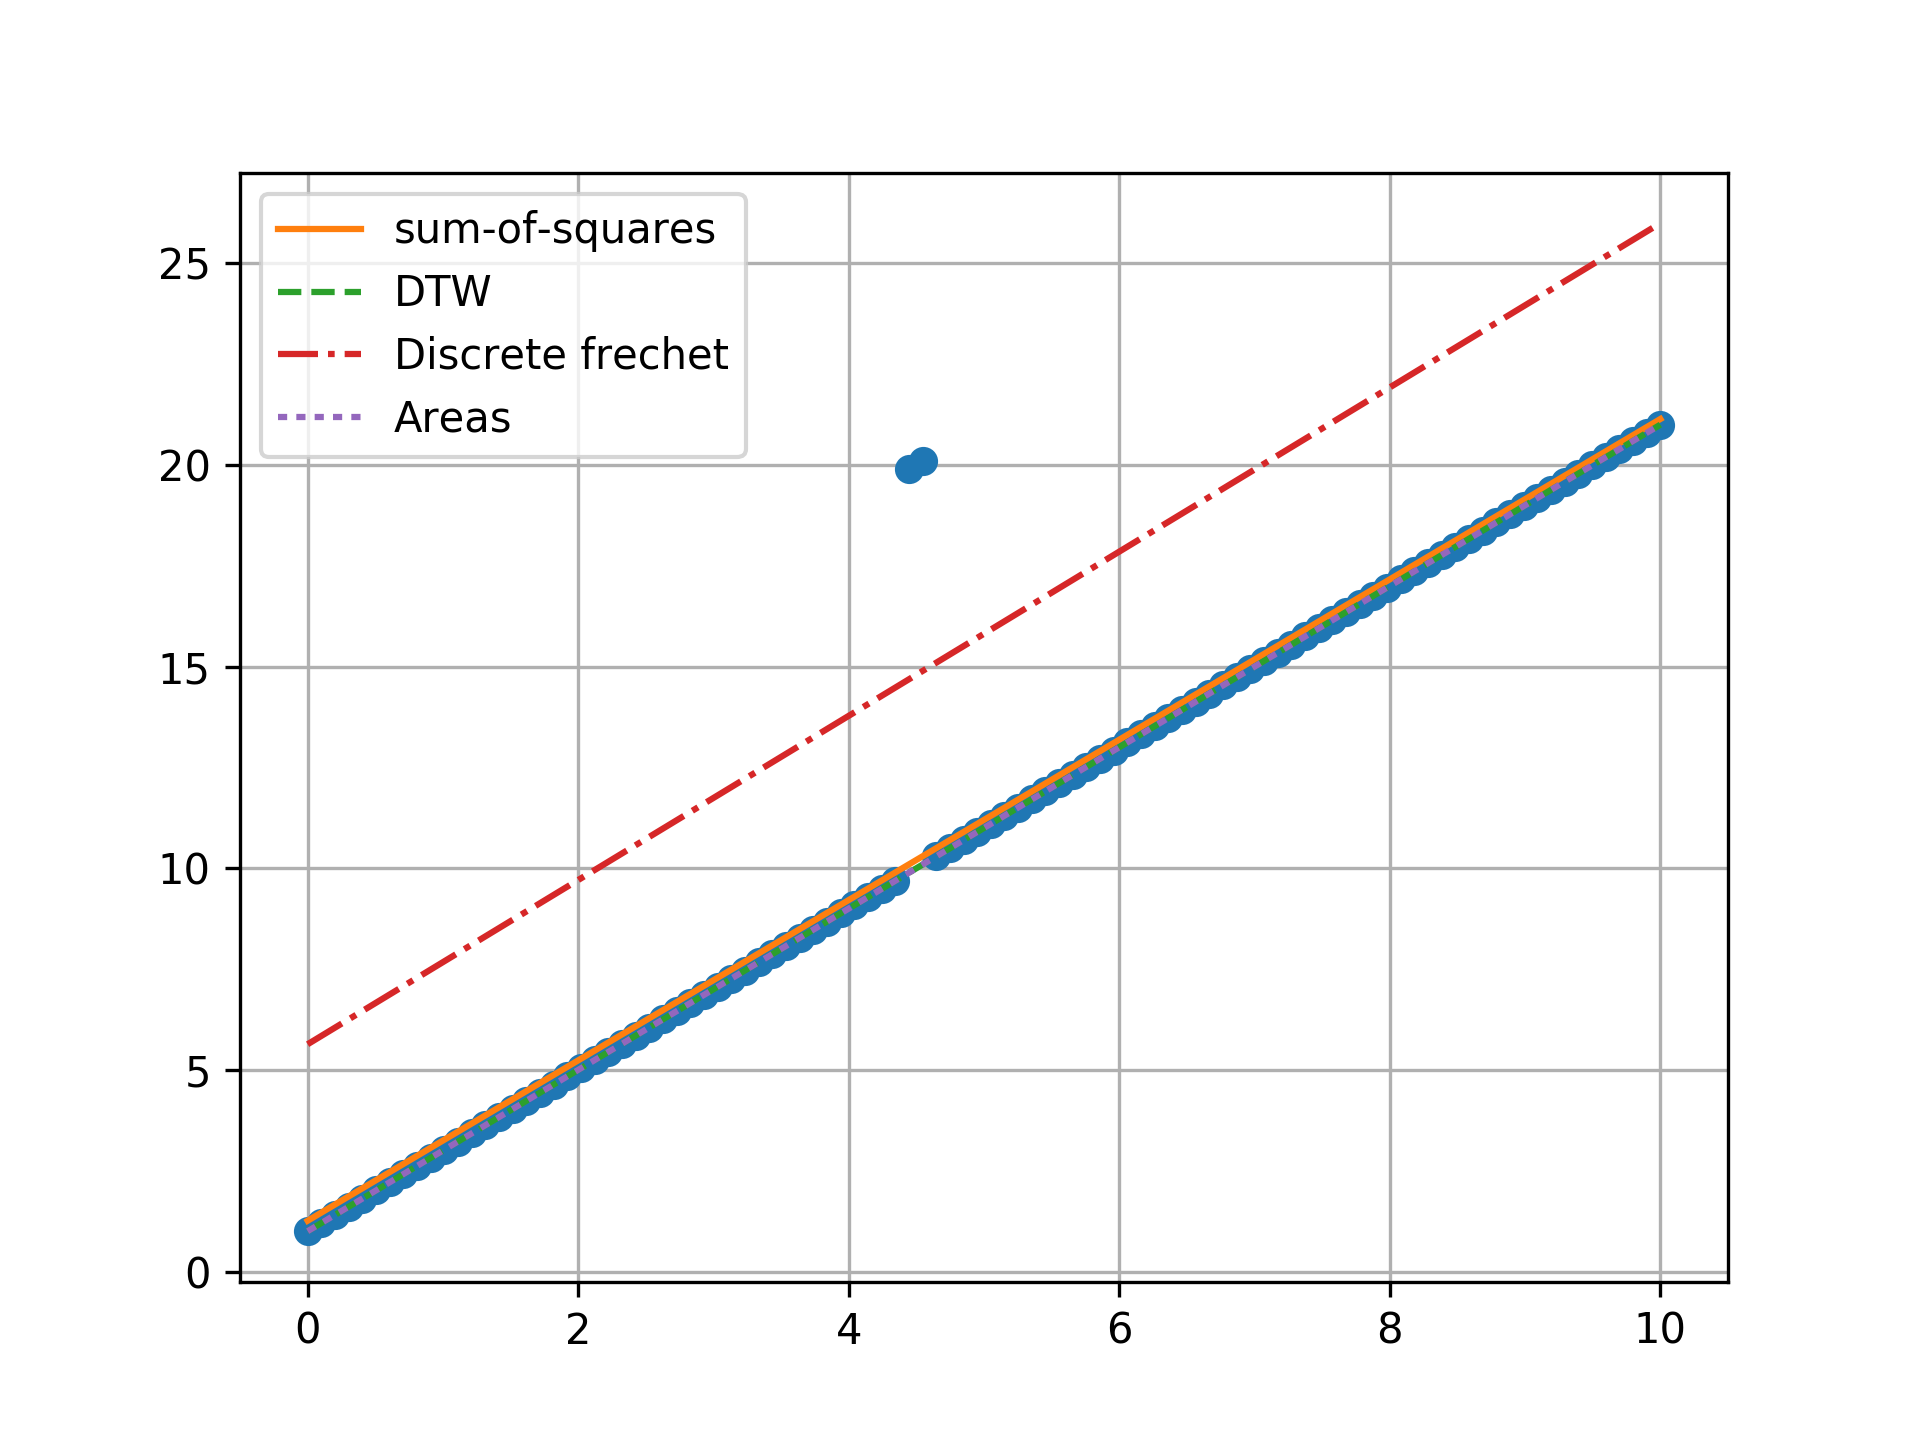
n = 100, two outlier, towards center
n = 100, three outlier, towards center
Conclusion
Minimizing the sum-of-squares creates a model that is a compromise between the outlier and the data. The line from the sum-of-squares minimization is slightly effected by the outlier, as the lines move slightly from the true trend. Minimizing the Fréchet distance is strongly susceptible to outliers. In this example minimizing the Fréchet distance appears to be analogous to minimizing the maximum absolute error. I was surprised to find that minimizing the DTW or area between curves produced the same results. Both the DTW and area metrics completely ignore outliers and find the true line.