Fitting a piecewise linear function to data
April 1, 2017
Edit 2018-04-08 Major update to pwlf. Read this. The code in this post has been changed to reflect the new naming convention.
Edit 2017-11-03 Now you can install with pip!
Abstract
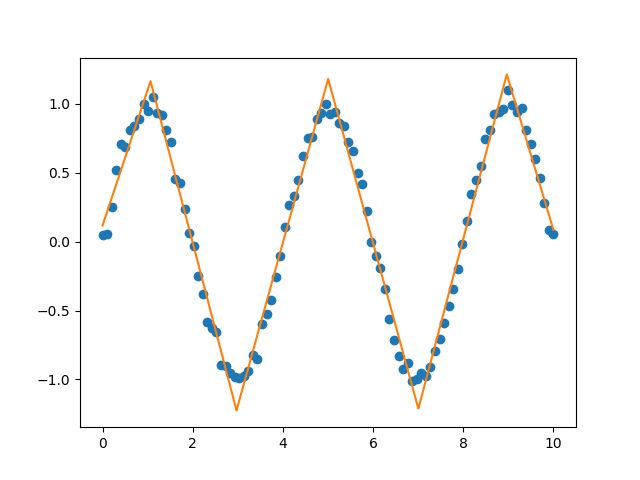
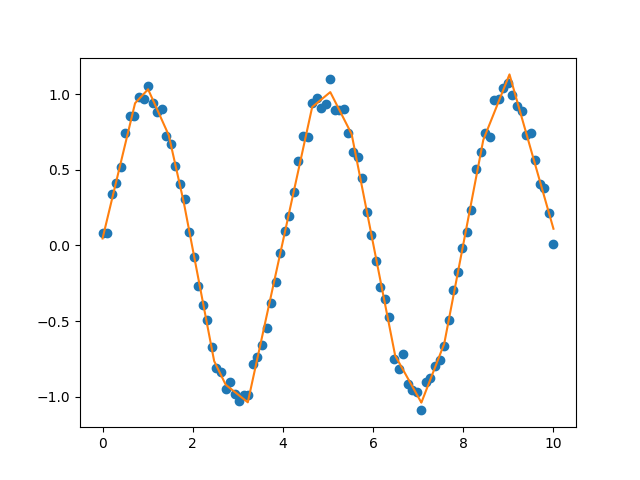
I created a Python library, called pwlf, for fitting a continuous piecewise linear function to data. What makes this library unique is that it allows the user to specify the desired number of line segments when performing piecewise linear fits. A global (heuristic) optimization algorithm is then used to find the best piecewise linear fit that uses the user-specified number of line segments.
Introduction
So let’s say we have data that exists in two dimensional space, where each point can be represented by \( (x,y) \). It is possible to fit a continuous piecewise linear function \( f(x) \) to the data using a least squares method, as long as the \( x \) locations of the line segment ends are known. Golovchenko (2004) covered the simple least squares derivation well if you want to see how the math works out.
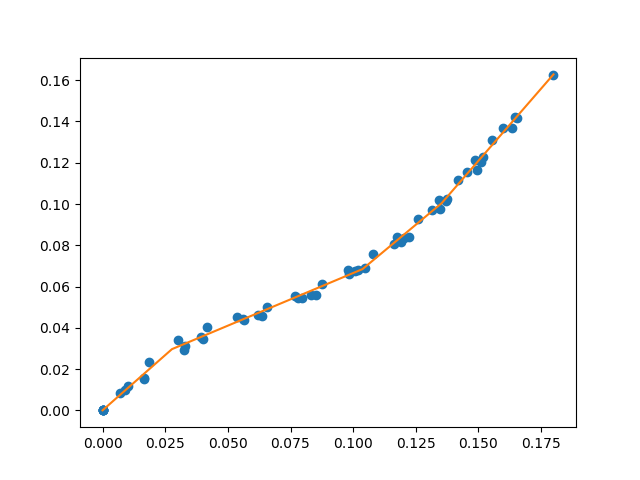
I took the least squares approach and coupled it to a global optimization algorithm (differential evolution) such that a user can specify the number of line segments to fit the data with. The routine finds the best location for the line segments by minimizing the sum of the square of the residuals. The result is the optimal continuous piecewise linear function for the specified number of line segments.
Feel free to download the library.
You can install the library with pip.
sudo pip install pwlf
A few examples of the fits are provided bellow.


Sample data
So let’s get started by importing the libraries and using some sample data.
#    import our libraires
import numpy as np
import pwlf

#   your data
y = np.array([  0.00000000e+00,   9.69801700e-03,   2.94350340e-02,
         4.39052750e-02,   5.45343950e-02,   6.74104940e-02,
         8.34831790e-02,   1.02580042e-01,   1.22767939e-01,
         1.42172312e-01,   0.00000000e+00,   8.58600000e-06,
         8.31543400e-03,   2.34184100e-02,   3.39709150e-02,
         4.03581990e-02,   4.53545600e-02,   5.02345260e-02,
         5.55253360e-02,   6.14750770e-02,   6.82125120e-02,
         7.55892510e-02,   8.38356810e-02,   9.26413070e-02,
         1.02039790e-01,   1.11688258e-01,   1.21390666e-01,
         1.31196948e-01,   0.00000000e+00,   1.56706510e-02,
         3.54628780e-02,   4.63739040e-02,   5.61442590e-02,
         6.78542550e-02,   8.16388310e-02,   9.77756110e-02,
         1.16531753e-01,   1.37038283e-01,   0.00000000e+00,
         1.16951050e-02,   3.12089850e-02,   4.41776550e-02,
         5.42877590e-02,   6.63321350e-02,   8.07655920e-02,
         9.70363280e-02,   1.15706975e-01,   1.36687642e-01,
         0.00000000e+00,   1.50144640e-02,   3.44519970e-02,
         4.55907760e-02,   5.59556700e-02,   6.88450940e-02,
         8.41374060e-02,   1.01254006e-01,   1.20605073e-01,
         1.41881288e-01,   1.62618058e-01])
x = np.array([  0.00000000e+00,   8.82678000e-03,   3.25615100e-02,
         5.66106800e-02,   7.95549800e-02,   1.00936330e-01,
         1.20351520e-01,   1.37442010e-01,   1.51858250e-01,
         1.64433570e-01,   0.00000000e+00,  -2.12600000e-05,
         7.03872000e-03,   1.85494500e-02,   3.00926700e-02,
         4.17617000e-02,   5.37279600e-02,   6.54941000e-02,
         7.68092100e-02,   8.76596300e-02,   9.80525800e-02,
         1.07961810e-01,   1.17305210e-01,   1.26063930e-01,
         1.34180360e-01,   1.41725010e-01,   1.48629710e-01,
         1.55374770e-01,   0.00000000e+00,   1.65610200e-02,
         3.91016100e-02,   6.18679400e-02,   8.30997400e-02,
         1.02132890e-01,   1.19011260e-01,   1.34620080e-01,
         1.49429370e-01,   1.63539960e-01,  -0.00000000e+00,
         1.01980300e-02,   3.28642800e-02,   5.59461900e-02,
         7.81388400e-02,   9.84458400e-02,   1.16270210e-01,
         1.31279040e-01,   1.45437090e-01,   1.59627540e-01,
         0.00000000e+00,   1.63404300e-02,   4.00086000e-02,
         6.34390200e-02,   8.51085900e-02,   1.04787860e-01,
         1.22120350e-01,   1.36931660e-01,   1.50958760e-01,
         1.65299640e-01,   1.79942720e-01])
Basic usage
First we initialize the pwlf library with our data. Then we’ll find the best piecewise linear function using 4 line segments. Once the fit has been performed, the library inculdes a prediction function which evaluates the piecewise linear model. In this example we evaluate the piecewise linear model for 10,000 different xHat locations.
#   initialize piecwise linear fit with your x and y data
myPWLF = pwlf.PiecewiseLinFit(x,y)

#   fit the data for four line segments
res = myPWLF.fit(4)

#   predict for the determined points
xHat = np.linspace(min(x), max(x), num=10000)
yHat = myPWLF.predict(xHat)
It was intended that this syntax be simple to use.
But what if I know the locations of where the line segments should end? Not a problem! This library includes the function for classic least squares fit as well. For instance you could run the following code to fit the piecewise linear function at the x0 locations.
#   your desired line segment end locations
x0 = np.array([ min(x), 0.039, 0.10, max(x)])

#   initialize piecwise linear fit with your x and y data
myPWLF = pwlf.PiecewiseLinFit(x,y)

#   fit the data with the specified break points (ie the x locations of where
#   the line segments should end
myPWLF.fit_with_breaks(x0)
Conclusion
A library was created for fitting a continuous piecewise linear function. What makes this library unique is it allows the user to perform the fit by specifying the number of line segments to use. Feel free to check out the code and the examples.
This can be a very difficult optimization problem. I’ve included an example if you wanted to use your own/custom optimization algorithm. For problems with large amounts of data and line segments, the optimum may take awhile to find.
If you need help using the library or have any suggestions please let me know!